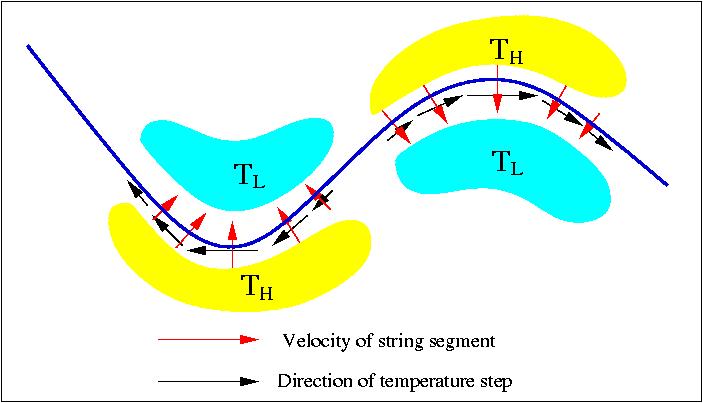
Figure 11. Temperature step configuration by a curvy cosmic string. The region toward which cosmic string is moving is red shifted and makes a lower temperature region while opposite side of the string segment is blue shifted (hotter region).
We search this patterns of temperature anisotropy as a possible signal from cosmic string.
Two examples of patterns found in the real anisotropy map are shown below with optimal height of temperature step that fits best with the pattern.

Figure 12. Examples of patterns which show long sequences temperature steps.
The pattern on the right has well aligned steps but it is not consistent with the curvature and resulting velocity configuration of cosmic string. Therefore, its expected temperature step is zero, i.e.. it is not considered as a signal produced by a cosmic string. The pattern on the left does not look convincing but when taken into account the background (Gaussian) fluctuation, it meets the requirement for being pattern produced by a cosmic string with optimal height of step
 . Collecting
all the patterns found in the CMB anisotropy map, we plot the
distribution of temperature steps in the Figure 13.
. Collecting
all the patterns found in the CMB anisotropy map, we plot the
distribution of temperature steps in the Figure 13.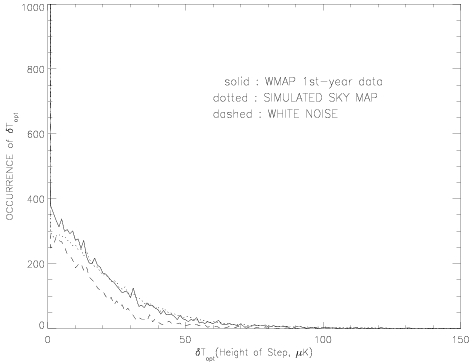
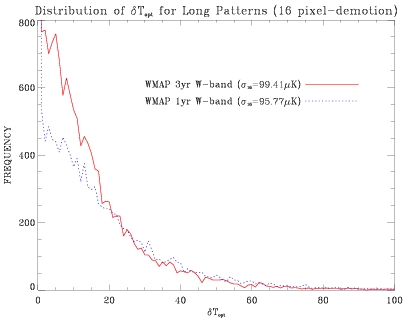
Figure 13. Distributions of
 for WMAP data set, simulated sky
map and white noise.
for WMAP data set, simulated sky
map and white noise. We estimate from the plots above that
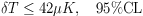 and it corresponds to the limit
for the string parameter
and it corresponds to the limit
for the string parameter  . The energy scale of symmetry
breaking that is responsible for the production of cosmic string is
related by the string parameter as
. The energy scale of symmetry
breaking that is responsible for the production of cosmic string is
related by the string parameter as  where
where  represents
the energy scale of symmetry breaking and we find from the limit of
string parameter,
represents
the energy scale of symmetry breaking and we find from the limit of
string parameter,  .
.