 Space Sciences Laboratory - University of California        note      pages: N
             at Berkeley Astrophysics Note               number: 482
         keywords: GEM, 408 MHz, antenna beam              by: Giovanni De Amici
           The 408 MHz beam antenna profile                 date: december 1995
THIS DRAFT DOES NOT INCLUDE GALACTIC OR SIDELOBES CORRECTIONS
Abstract
The beam of the 408 MHz antenna used at the Bishop site in winter/spring 1994 has been estimated. The results, as well as details of the calculations and a brief discussion of the shortfalls of the technique used, are given here.
Characteristics of the antenna
The GEM measurements at 408 MHz are done with a parabolica antenna of diameter 5.5 m. The focal lenght of the parabola is 1.8 m. The main reflector is extended in diameter to 9.5 m by additional metallic panels; the angle of these panels is adjusted to undercut the angle of the main reflector. The additional panels are expected to act more as ground screens than as as extensions of the parabola.
The choice of feed antenna for the parabola was constrained by the preference for a prime-focus arrangement, the need to maintain obscuration to a minimum, the desirability of a circularly polarized antenna, and the design requirement that the GEM instrument could be easily switched to work at a different frequency.
In order to obtain a ~8deg. beam in the sky at 408 MHz, the parabola needs to be almost fully illuminated. The need to keep the sidelobes as low as possible, suggest to taper the illuminating field. Rahmat-Samii (1988) derives the values in table 1 for the ideal situation of a parabola illuminated by a feed antenna negligibly small.
Using those values as guidelines, and assuming a 10dB illumination at the parabola edge, with our f/number of 0.33, that requires that the beam of the feed antenna has 10dB half-opening angle of 74deg..
 Table 1 - Characteristics of a tapered circular aperture
edge illumination          HPBW           level of first    illumination of
       [dB]           [[[lambda]]/2a      sidelobe [dB]     reflector [%]
                           rad]
        0                  1.01               -17.6         100
        -3                 1.06               -19.1         97.8
       -10                 1.14               -22.3         91.7
       -20                 1.21               -24.3         81.7
 where [[lambda]] is the wavelenght and a is the radius of the aperture
A backfire helical antenna (Johnson and Cotton 1984, Nakano 1988 ) seemed to be the best compromise. It was assembled in our laboratory, winding copper tubing (diameter 0.95 cm, wall thickness 0.16 cm) around a cylinder of plexyglass (diameter 20.2 cm wall thickness 0.6 cm) which acted as the supporting structure. Allowing for the dielectric constant of plaxyglass, the electric diameter of the helix was 1.05 wavelenghts (check this!). The helix was held in place with plastic screws and clamps. The pitch of the helix was 14deg., for a total lenght of 145 cm on 9.5 turns.
A copper plate, of diameter 13 cm (0.2 [[lambda]] at 408 MHz) acted as ground plane. The helix was brought to feed a low-loss coaxial cable (Andrew LDF4-50); the impedence of the helix was matched to the transmission line via a microstrip balun transformer.

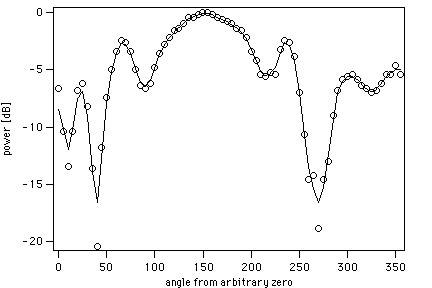
Figure 1 - The beam pattern of the scale model of the GEM backfire helical feed; data were taken at 4.02 GHz. o : measured data ; -- : smoothed profile
We used a network analyzer to measure the VSWR of the antenna and transformer: it was better than -15dB across the frequency band of interest (385-425 MHz).
Measurement technique
Because of the size of the helix antenna and the low frequency of operation, only a very coarse measurement of beam pattern was possible at LBL. A 1:10 scale model of the feed and parabola was made, and its beam pattern was measured on the roof of b.50 at LBL. The results are shown in figures 1 and 2. The actual feed was also measured, but the test proved difficult to conduct and to interpret. More accurate measurements were expected to be done during field operations.
One set of these measurements was done between 27 march and 5 april 1995. The measurements consisted in conducting nominal GEM observations during the daytime, and while making sure that the Sun was swept by the antenna beam. Several such runs were done; because of the high antenna temperature of the Sun, the receiver output would usually saturate when the solar angle was less than 7 deg. In order to accurately map the center part of the antenna beam, the receiver gain was reduced by 4 dB during one of the observing runs.
The measurements were taken between 8:00 and 16:00 PST; the receiver temperature was typically 30deg.C, well above the regulating point of the (then) setup.
Data were taken during clear days, with little wind; high wind and/or clouds caused the system to be turned off. Altogheter there are about 34 hours of observations, with Sun-beam angles ranging up to 100deg..
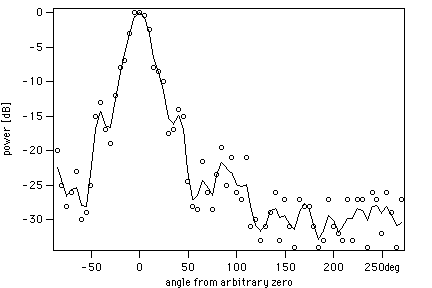
Figure 2 - The beam pattern of the scale model of the GEM parabola with a backfire helix feed; data were taken at 4.02 GHz. o : measured data ; -- : smoothed profile
Figure 3 shows the relative position of the Sun and the Galaxy during one of the runs. Given the short time lag between runs, the position of the Galaxy did not change appreciably during the measurement series.
Analysis of the data
Each data file was analyzed separately, to produce several independent beam profiles. The data were corrected for NS pulses, RFI, receiver temperature, azimuth encoder offset, elevation encoder slippage, time stamp delay.
*NS pulses
The external NS signal is clearly marke in the data stream by a flag: all data points were the flag was raised were excised from the data; as a safety measure against timing delays in the recorder, one additional datum was eliminated before and after the NS flag. The resulting gaps were filled by interpolation (with a second order polinomial) from the adjacent measurements.
*RFI spikes
I first attempted to excise the RFI spikes, as flagged by the dedicated circuit, using the same algorithm used for NS pulses. The quality of the resulting data was less than encouraging. I found that attempting to fill-in the gaps left after excising the RFI contaminated data is at best a difficult task: the 'cleaned' file is left with several data points clearly out of range. There are several possible reasons for this effect; first and foremost being the fact that the threshold of the flagging circuit might have been set too high. I tried to analyze the data both with the RFI spikes taken out (and replaced by NotANumber's) and left in. The results are practically indistinguishable. For this analysis I choose to leave the RFI spikes in the data stream, for sake of simplicity of analysis.
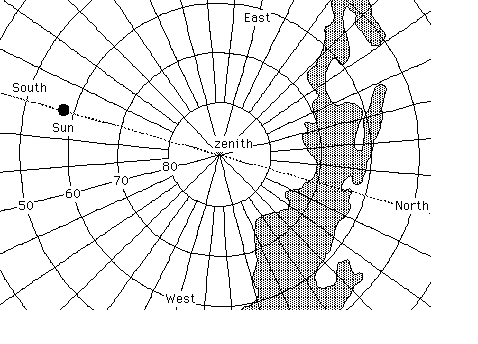
Figure 3 - The sky at about 12:00 PST (20:00 UT) of 2 april 1994 is shown in altazimuth projection from Bishop, CA. The dashed area corresponds to the Galactic disk in visible light. The GEM scan patterns at 20, 30 and 40deg. from zenith cross the Galactic plane at solar angles as small as 45deg. from beam axis.
*Receiver temperature
The receiver temperature fluctuated about +/-1deg.C around 30.5deg.C during the measurements. This is quite higher than the nominal temperature of 25deg.C kept during nighttime operations. The output signal was converted back to fiduciary temperature using the results of the analysis of thermal susceptibility tests conducted between 30 mar and 5 apr 1994 (more details on those in an upcoming APN)
*Azimuth encoder offset
The azimuth encoder reading of zero is arbitrarily set at the time of assembly of the antenna. The setup does not have any way to adjust the offset, so a constant value must be measured (or calculated) and subtracted from the recorded data, to bring the encoder to read the correct azimuthal angle (we use the convention of N=0deg., E=90deg., S=180deg., W=270deg.). Direct measurements (using Polaris) were done in the field on ?? jan, 18 feb, 4 apr (twice) 1994. The results of those measurements are: 140.8deg., 141.1deg., 139.6deg. and 139.1deg.. Details of these measurements (all done with the same technique) are in the logbooks.
I analyzed the data using different values of offset, in the range 138deg.-141deg.; the goodness of the results was evaluated from the rms of the data, binned by sky pixel (I assumed that , no matter what the RFI and receiver noise are, the least scatter in the data derives from binning data from the same sky pixel together). Values of offset between 138.5deg. and 140.5deg. gave very similar results, with only slight degradation of the curves. The 'best' result was had for offset of +139.5deg., with a +/-1deg. uncertainty. The quality of the fits worsened very quickly as the offset was deviated from the value above. This result is in good agreement with the values measured directly, and raises a question regarding (possible) slight slippage of the encoder between january and april 1994
*Elevation encoder slippage
Toward the end of the winter-spring 1994 run, it was observed that the elevation encoder output had changed (for a given zenithal angle) since the beginning of the experiment. Furthermore, direct observation of the output in real time, showed changes on short time periods. I attributed this behaviour to slippage in the coupling between the antenna axis elevation and the encoder axis. Beside tightening the coupling screw, the pointing angle was measured with the precision clinometer before and after each run: the measured value was recorded and used to replace the encoder output for this analysis.
*Time stamp delay
The time acquired by the DAQ software at those times is by design imprecise. There is an intrinsic +/-0.5 sec uncertainty, caused by the fact that the Mac's clock only ticks at intervals of 1 second, while the data are recorded at 0.56 second intervals; furthermore, whenever data were kept in the buffer for any lenght of time, several data points were be recorded with the same time stamp. Although the consequences are minimal (I only use the time stamp to determine the position of the Sun during measurements, and even a 1 hour error in time stamp changes the result by only 0.05deg.) the time stamp was fit with a straight line.
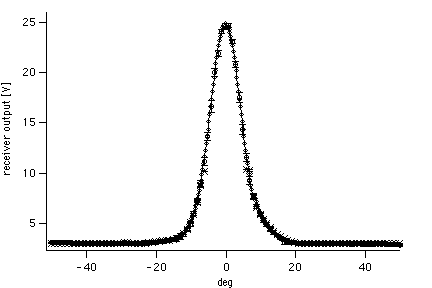
Figure 4 - The beam pattern of the 408 MHz GEM antenna. x : results from scans with receiver at full gain (center part of the beam is saturated); o : results from scans with receiver at reduced gain ; -u- : fitted profile.
After the corrections, the pointing of the beam was converted to RA-dec coordinates and the position of the Sun was computed. The beam-Sun angle was then derived. Arbitrarily, negative values of angle were assigned when the Sun was to the East of the beam. Since there is not enough sky coverage (due to the relative position of the Sun and the beam about 1/2 of the beam pattern is never illuminated by the Sun) to map the beam in two dimensions, I neglected the azimuth information and reduced the analysis to a slice across the antenna beam pattern. The data were binned by radial distance from the Sun, with each bin being therefore the combination of all data points lying at the given angle, but at random azimuths.
Data points at or above (due to interpolation of NS pulses) the 10V full scale receiver output were blanked out. All the data within each 1-deg bin were then averaged together, and outliers (points further than 3 standard deviations) from the mean were excised. The averaging and excision was repeated on the remaining data, until no outliers remained. When the average was close enough to the 10V full-scale output of the receiver, the 3 standard deviation threshold was lowered, so that the low-side of the distribution would not be weighted more than the high-side. Even so, the small number of data points near the solar transit produce large error bars in the average.
Each file was used to produce one beam profile: because of the receiver saturation, most of such profiles only rapresent the antenna beam outward of 7 deg, and show discernible structures out to over 50 deg from center. These profiles can be merged togheter, to yield an averaged sample of the mid-distance beam. One file maps the center of the beam, with good details out to about 20 deg, where the receiver gain becomes insufficient to bring the sky signal above the noise.
I merged the two sets of data by requesting that the common average baseline (i.e. between 20 and 40 deg from beam center) be the same, and multiplying the signal in the beam center by 4 dB. The resulting profile was then fit with a gaussian curve between -2 and 15 deg, an exponential curve between 12 and 25 deg, and a 6th order polinomial between 22 and 40 deg. The fitting was done independently on either side of the peak.
Results
The final, best fit beam pattern is shown in figure XXX, togheter with the raw data for each of the scans and the combined scan. The center part of the beam was fit with a single gaussian between -15 and +15 deg. The antenna beam seems to be well approximated by a gaussian shape, with HPBW of 13.7+/-0.1deg., out to 18-20deg. from center. The chi-squared is 45.6 for 25 d.o.f. An additional 0.2deg. of pointing offset was subtracted before this plot was produced. Assuming the beam pattern to be symmetric, and the differences between East and West data to be caused by ground or sky asymmetries, I averaged the fits on either side of the maximum. The resulting beam pattern is tabulated form in Appendix 1; the error bar is the difference between the two fits.
Some structure is still visible in the data out to 40deg. from center; beyond that limit (which I took to be the limit of validity for this measurements) the signal rises again.
Discussion (aka: warnings and pitfalls)
Since the quality of the fit is only as good as the underlying data, we should ask how closely the data rapresent the beam pattern. RFI spikes were effectively removed from the data through binning, averaging and outliers-removing software. Ground contribution (if present) should manifest itself as an increase in the level of the baseline; a limit on the amplitude of this effect can be given by comparing the data taken at the same solar angle, but at different zenith angles. I limited the comparison to data bins between 20deg. and 40deg. of solar elongation, both to the E and W. The results are shown in figure XX, and are consistent with a null effect to within 2-sigma. The error bars shown are rapresentative statistical uncertainty, and correspond to +/-1K. There is no systematic gradient of signal
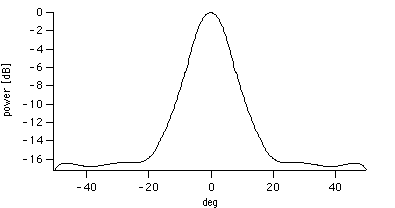
Figure 5 - The measured beam pattern; the results of the fits on both sides of the peak have been averaged to yield a symmetric profile.
level between 20 and 40deg. from zenith. I calculated the change in antenna temperature from a clear, uniform atmosphere (antenna temperature at the zenith 1K) and a 290K ground for an antenna whose beam is described (up to 35 deg from axis) by the one shown in fig YYY, and by the one in figure 2 outward. The expected signal change between 20 and 40 deg from zenith is less than 3 K (mostly caused by ground contribution through the sidelobes).
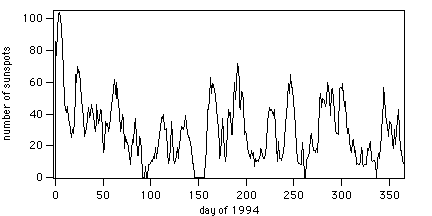
Figure 6 - Daily record of sunspots number during 1994, as archived by NGDC-NOAA. The beam pattern measurements discussed here were done between day 87 and day 94, which correspond to a marked minimum of activity.
The Sun is well know to be a variable radio source, especially at low frequencies. The solar radio flux correlates well with the number of observed sunspots (Kraus 1966). In figure XXX I have plotted the number of sunspots recorded daily during 1994: during the days of the measurements described here (day 87-94), the sunspot number is very low. I think we can neglect variations in the Sun's radio emission as a source of uncertainties in these measuremetns. For comparison, the monthly average number of sunspots during a minimum of the solar cycle is ~7, raising to ~130 during a maximum.
Using the rough calibration of 55.5 K/V calculated from hot/cold targets on 25 mar 1994, we can estimate the Sun's antenna temperature (averaged over the a 0.5deg. visible disk) to be ~500,000 K, in good agreement with the lower limits of radio intensity for periods of minimum solar activity. The solar contribution at 30deg. from beam axis is then ~30 K, and should not be neglected during the construction of skymaps.
Conclusions
The beam pattern of the GEM antenna at 408 MHz has been measured in the field out to 40deg. from axis. The results are in good agreement with the measurements conducted earlier on a scale model. The accuracy of the measurements bejond 35deg. is affected by the radio signal from the Galactic plane, which dominates the solar radio emission for beam angles greater than 40deg..
This analysis can be improved either by modelling the contribution of the Galactic plane and subtracting it out, or by repeating (with improved sensitivity and receiver stability) the measurements on the scale model.
Acknowledgements
The helical feed antenna project was supported primarily by Calspace, under grant ##### and (in part) by LBL under grant #####. I am indebted to M. Bensadoun, J. Gibson, D. Heine, M. Limon, C.Witebsky and J. Yamada for their help in the design and assembly of the GEM parabolic antenna and system. The precise determination of the elevation angle of the antenna was made possible by Dennis Wentzelius of Wedge Innovations, who kindly provided us with an upgraded version of their 'Smartlevel' software.
As usual, the staff and crew of the U.C.'s White Mountain Reserach Station in Bishop (CA) provided invaluable assistance during the data taking runs. We could not have overcome the large and small problems encountered in the daily operation of GEM without their help.
Data acquisition and analysis was performed entirely on Apple Macintosh computers, using National Instrument's Labview and Wavemetric's Igor software.
References
Rahmat-Samii, in Y.T. Lo & S.W. Lee (edts), "Antenna Handbook", Van Norstrand, NY 1988
R.C. Johnson and R.B. Cotton, IEEE, AP-32, 1126, 1984
H. Nakano et al., IEEE AP-36, 1359, 1988
J. Kraus, "Radio Astronomy", McGraw-Hill (New York, 1966)
Appendix A - Summary of results
Azimuth offset correction (winter-spring 1994) : +139.7 +/- 1.2 deg.
Parabolic antenna with helical feed HPBW : 13.7 +/- 0.1deg. (statistical error in the fit, only)
Radial beam pattern (symmetrized):
angl   normalized    error [dB]      angl   normalized    error [dB]
   e   power [dB]                     e     power [dB]
[deg                                 [deg
   ]                                  ]
 0         0        0
 1       -0.11      0.001             26      -16.38     0.156
 2       -0.45      0.003             27      -16.37     0.111
 3       -1.00      0.004             28      -16.37     0.073
 4       -1.76      0.005             29      -16.38     0.043
 5       -2.72      0.007             30      -16.41     0.023
 6       -3.86      0.008             31      -16.44     0.013
 7       -5.15      0.008             32      -16.49     0.011
 8       -6.52      0.009             33      -16.55     0.019
 9       -7.65      0.182             34      -16.61     0.033
 10      -8.79      0.342             35      -16.67     0.055
 11      -9.87      0.463             36      -16.73     0.083
 12      -10.88     0.539             37      -16.77     0.115
 13      -11.80     0.563             38      -16.79     0.150
 14      -12.62     0.535             39      -16.80     0.188
 15      -13.34     0.458             40      -16.79     0.228
 16      -13.97     0.341             41      -16.74     0.269
 17      -14.61     0.047             42      -16.68     0.313
 18      -15.13     0.101             43      -16.60     0.360
 19      -15.56     0.216             44      -16.52     0.412
 20      -15.89     0.290             45      -16.46     0.474
 21      -16.11     0.324             46      -16.41     0.551
 22      -16.26     0.323             47      -16.42     0.651
 23      -16.34     0.297             48      -16.51     0.788
 24      -16.37     0.254             49      -16.71     0.984
 25      -16.38     0.205             50      -17.12     1.288