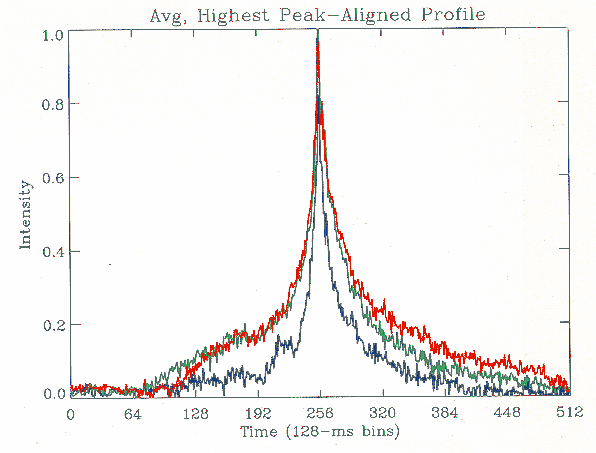
(Original image from the BATSE Pages at GSFC.)
This plot illustrates the average time history for many bursts observed by BATSE divided into bright (blue) and dim (red and green) groupings. Within each group the burst time histories have been normalized to a maximum intensity of 1.0 and aligned at their highest peaks. The dim burst groups appear broader or stretched when compared to the bright group suggesting a cosmological time dilation may be present. This is support for the cosmological distance view.