 U2 Anisotropy Experiment:
U2 Anisotropy Experiment:
U2 Anisotropy Experiment:
This was an experiment designed to measure the isotropy and detect the first order anisotropy in the cosmic microwave background CMB that was due to our motion in the Solar System's orbit around the Galaxy. The experiment was flown aboard the NASA Ames U2 jet aircraft.
The dipole, or more correctly first order, anisotropy of the CMB looked like this when first observed by the U2:

Map of the dipole anisotropy as detected by our U2 experiment. The map varies smoothly from -3.5 thousandths of a degree Kelvin (3.5 mK) in a direction near the constellation Aquarius shown as blue to +3.5 mK in the direction near the constellation Leo is shown as red. Astronomers think the colors should go the other way; however, most people think of red as warmer and blue as colder so that this and later maps like those made by COBE (shown below) are shown the way that people will intuitively get right.
The orignal map was made using data from the nothern hemisphere resulting from flights made from NASA Ames in Sunnyvale, California. Later measurements in the southern hemisphere, made from Jorge Chavez Airport in Lima Peru, indicate that the southern hemisphere fit the same pattern. Those additional measurements indicate that the warmest spot is actually slightly below the equator instead of slightly above. (See the 3-mm wavelength map below.) Click here for Information and photographs about the observations from Peru.
If one measures the temperature and plots it versus the angle from the warmest direction, a first-order anisotropy will follow a cosine curve as plotted in red below. The U2 data points are plotted on the same graph. Within the expected variation due to instrument noise they indicate the first-order anisotropy exists and fits them well.

Our next set of observations with a
cooled 3-mm wavelength (90 GHz) receiver
made a more direct
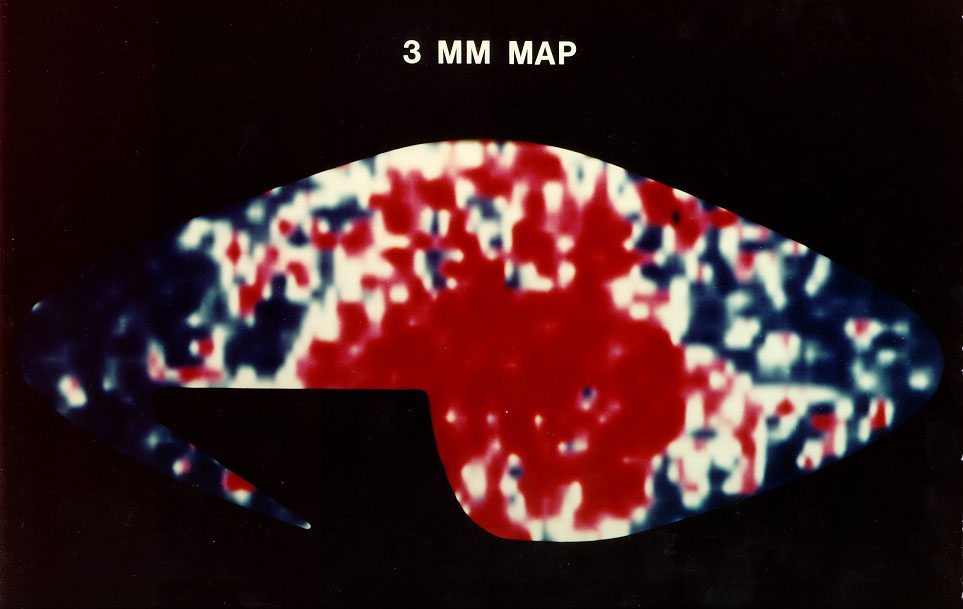 3-mm map of the microwave sky .
This map was made from three flights - two in the northern hemisphere
an one from Brazil.
Note that the maximum of the dipole - the center of the red -
is near the center of the map just below the equator when shown
in celestial coordinates.
3-mm map of the microwave sky .
This map was made from three flights - two in the northern hemisphere
an one from Brazil.
Note that the maximum of the dipole - the center of the red -
is near the center of the map just below the equator when shown
in celestial coordinates.
The COBE DMR has made the best measurement and map of the dipole anisotropy and the dipole amplitude and direction are now a calibration signal for CMB anisotropy experiments.

This figure shows the COBE DMR micorwave map of the sky in Galactic coordinates. To first order the sky is extremely uniform. The color scale on this figure is designed to show the variation (-3.5 to +3.5 mK) at the part in about one thousand level of the 2.728 K. The first-order anisotropy is very apparent and dominates the figure. Galactic emission shows up as a thin band and bumps along the central horizontal of the figure. That Galactic emission is why this map is in Galactic coordinates - to make it easier for the viewer to separate the dipole and the Galactic emission.
The CMB dipole anisotropy stands out by two orders of magnitude above any other CMB anisotropies.
We attribute the dipole anisotropy to the motion of the Earth and Solar System relative to the universal CMB radiation field and thus the distant matter in the Universe. This would seem to violate the postulates of Galilean and Special Relativity but there is a preferred frame in which the expansion of the Universe looks most simple. That frame is the average rest frame of the matter and CMB and from that frame the expansion is essentially isotropic.
The motion of an observer means that photons arriving from the direction of motion are boosted in energy. Those from behind lose energy. An like a car driving in the rain, more rain falls on the front winshield than the rear window. In its full form this is called the Doppler effect. The motion of an observer with velocity v relative to an isotropic blackbody of temperature To produces a Doppler-shifted temperature
T( theta ) = To ( 1 + (v/c) cos( theta ) + 0.5 (v/c)^2 cos( 2 theta ) + ... )
where theta is the angle between the direction of observation and the direction of motion. This formula predicts a uniform background at temperature To which has superimposed upon it a dipole anisotropy [cos( theta )] with amplitude (v/c)To. The next term is down by another factor of (v/c). Since the observed variation is roughly one part in a thousand, it meas the observer is moving with v/c = 10^{-3} or about a thousandth of the speed of light. That corresponds to a velocity of 300 kilometers per second or 1,080,000 kilometers per hour.
To our surprise the direction of motion determined from these observations was not aligned with the orbital motion of the Solar System around the Galaxy. Instead it was nearly in the opposite direction. That means that our Galaxy, in fact the whole local group of galaxies, is moving with a speed of more than one million miles per hour. A big question at the time was what was causing that motion? A proposed answer was it was the effect of the gravitational pull of the "Great Attractor". The "Great Attractor" was postulated to explain our motion and its predicted location was near to our Galactic plane so that it would have been obscured by stars and dust. A search was started and as an eventual result it was found that such large clumps of matter as the hypothesized "Great Attractor" are regularly found through the Universe. It is now believed that summing over the mass in our "neighborhood" (within a 100 million light years) one finds the net unbalanced attraction that explains our motion as detected in this experiment. The CMB is then the standard frame of reference for cosmolgy work.
The COBE DMR observations clearly show the change in velocity at the 30 kilometers per second - a 10% effect - due to the motion of the Earth around the Sun. One can see a clear sinsusodial pattern in the amplitude and direction of the dipole with a one year period in the four years of COBE DMR data. Differencing maps taken six months apart produces the familar dipole pattern with the amplitude and direction of the Earth's motion. This is good evidence that Galileo is right - the Earth does go around the Sun.
Some interesting photographs:
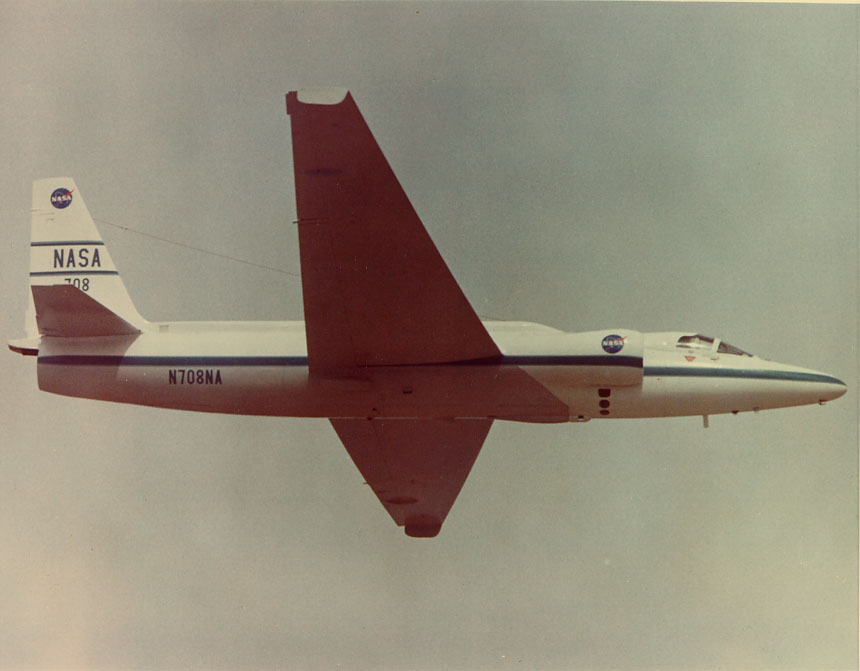 flying U2
Click here
for more photographs and information about the U2 DMR instruments.
Peru Campaign Photographs and Information
Click here for information and photographs
of the U2 pilot and flight preparations.
George Smoot took these photographs during the campaign in Peru
so that there was ready access and difficult conditions.
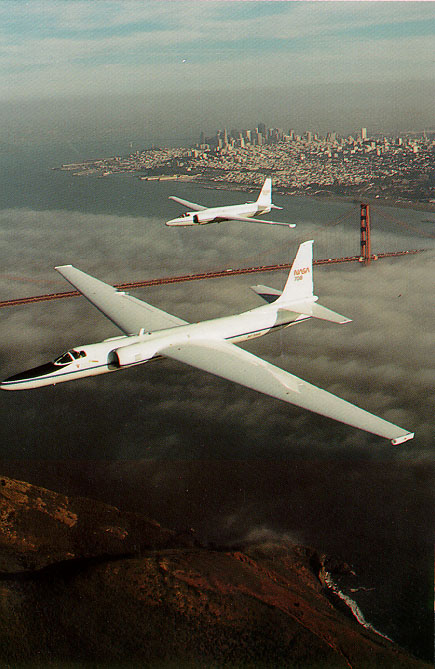 two U2s flying above the Golden Gate Bridge with San Francisco
in the background.
two U2s flying above the Golden Gate Bridge with San Francisco
in the background. 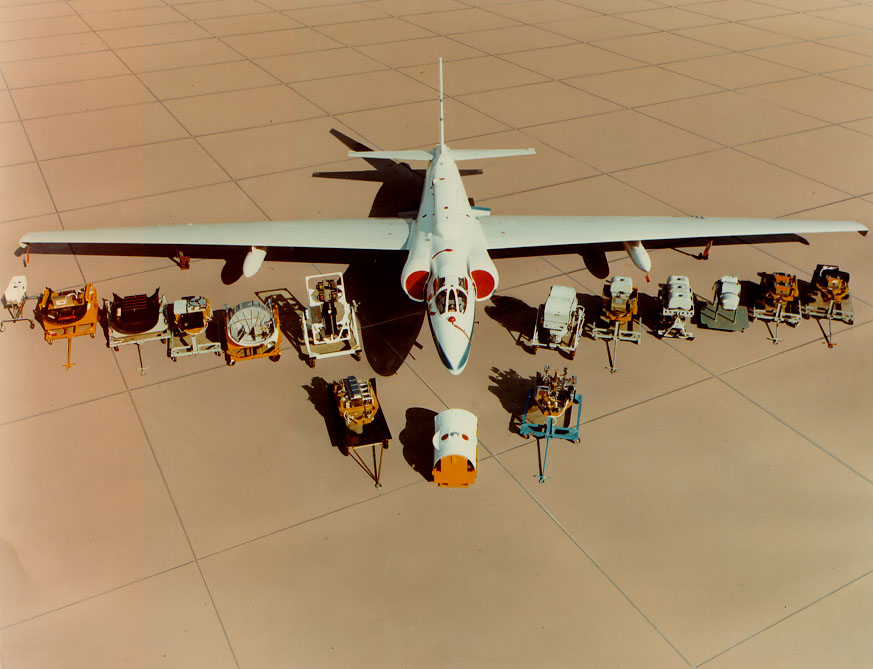 U2 with experiment payloads
Shown are the various payloads the NASA Ames U2 aircraft
was actively flying at the time (circa 1979).
Note our anisotropy package just in the front.
Our package was the only upwards looking instrument.
The others were mostly Earth Resources instrumentation.
U2 with experiment payloads
Shown are the various payloads the NASA Ames U2 aircraft
was actively flying at the time (circa 1979).
Note our anisotropy package just in the front.
Our package was the only upwards looking instrument.
The others were mostly Earth Resources instrumentation. 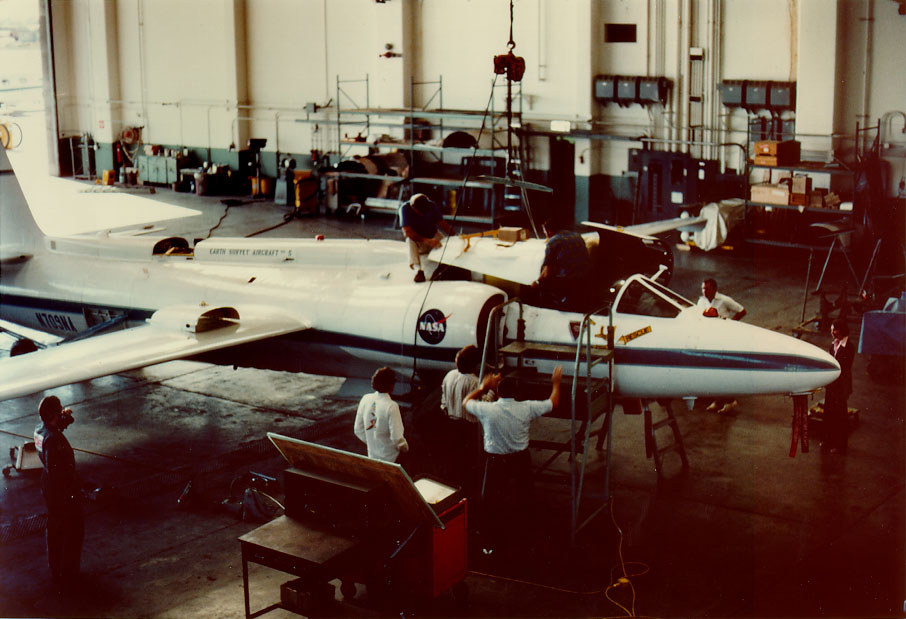 experiment being lowered into the U2. George Smoot standing
next to the steps to the cockpit with back to you.
Others are the various U2 maintenance and operating crew.
experiment being lowered into the U2. George Smoot standing
next to the steps to the cockpit with back to you.
Others are the various U2 maintenance and operating crew. 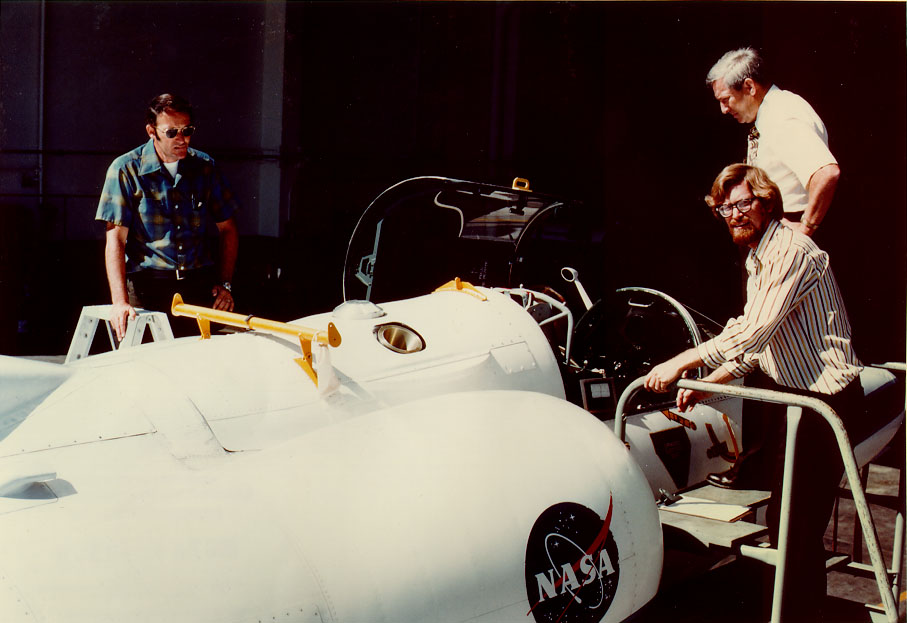 George Smoot (red hair) checks out experiment in U2
with the help and advice of two NASA Ames/Lockheed personnel.
George Smoot (red hair) checks out experiment in U2
with the help and advice of two NASA Ames/Lockheed personnel. 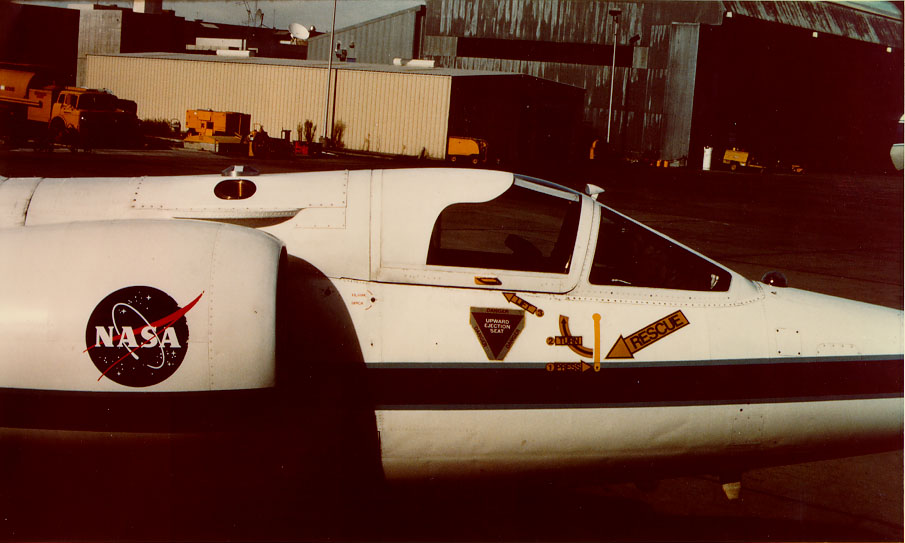 U2 with experiment inside outside the hanger in preparation
for flight. Part of the preflight checkout required going outside
both to run on the U2 flight systems and to see the sky with the equipment.
U2 with experiment inside outside the hanger in preparation
for flight. Part of the preflight checkout required going outside
both to run on the U2 flight systems and to see the sky with the equipment. 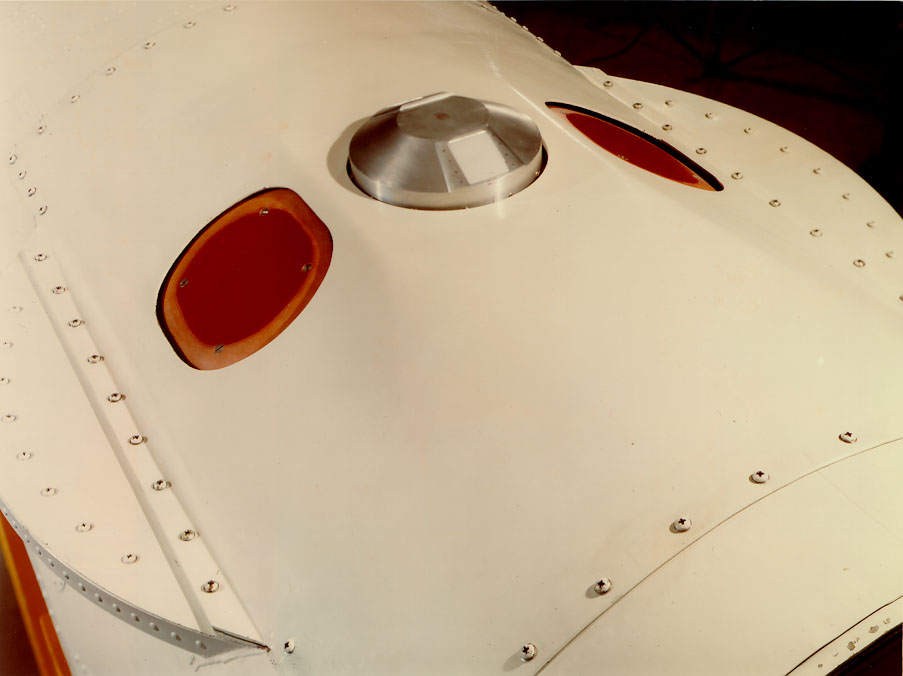 experiment in stored position
This photograph shows experiment in the stored - also take off
and landing position. Two redish plastic disks match to the surface
of the upper hatch for good aerodynamics. The disks are surrounded
with a track holding brush bristles to seal against dust and dirt
being blown into the equipment.
experiment in stored position
This photograph shows experiment in the stored - also take off
and landing position. Two redish plastic disks match to the surface
of the upper hatch for good aerodynamics. The disks are surrounded
with a track holding brush bristles to seal against dust and dirt
being blown into the equipment. 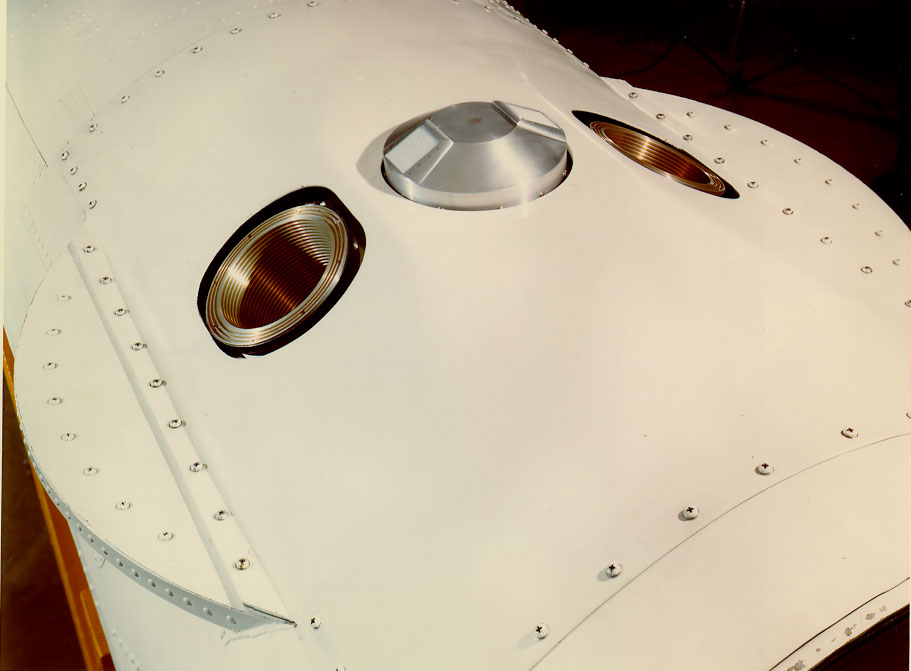 experiment in observing position
The two antennas point outwards through the two holes in the upper hatch
and are essentially flush with the surface of the aircraft skin.
Through the center hole protrudes an aluminum housing
for the atmospheric monitoring radiometer.
experiment in observing position
The two antennas point outwards through the two holes in the upper hatch
and are essentially flush with the surface of the aircraft skin.
Through the center hole protrudes an aluminum housing
for the atmospheric monitoring radiometer. 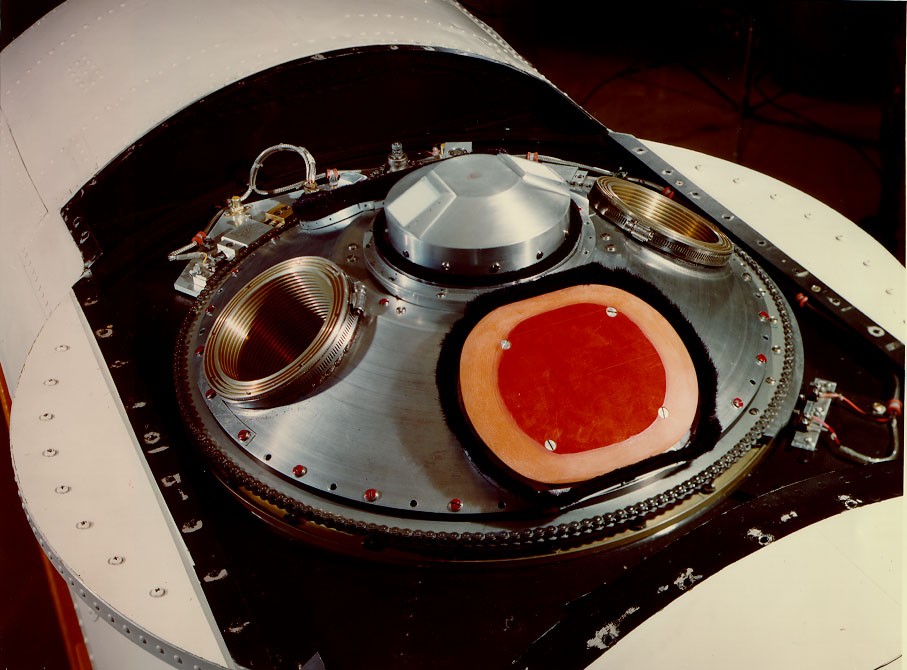 experiment in observing position with the upper hatch cover off.
You can see the protecting aluminum can, the antennas, and the sealing
plastic disks as well as the system for rotating the experiment.
The rotation is both for storing and observing. During observing the
antennas were interchanged about once per minute by rotating plus
and then minus 180 degrees. In this picture and the next one can
see the chain drive, microswitches, stops, etc. that were necessary
to accelerate smoothly rotate around and stop at the same precise angle
each time.
experiment in observing position with the upper hatch cover off.
You can see the protecting aluminum can, the antennas, and the sealing
plastic disks as well as the system for rotating the experiment.
The rotation is both for storing and observing. During observing the
antennas were interchanged about once per minute by rotating plus
and then minus 180 degrees. In this picture and the next one can
see the chain drive, microswitches, stops, etc. that were necessary
to accelerate smoothly rotate around and stop at the same precise angle
each time. 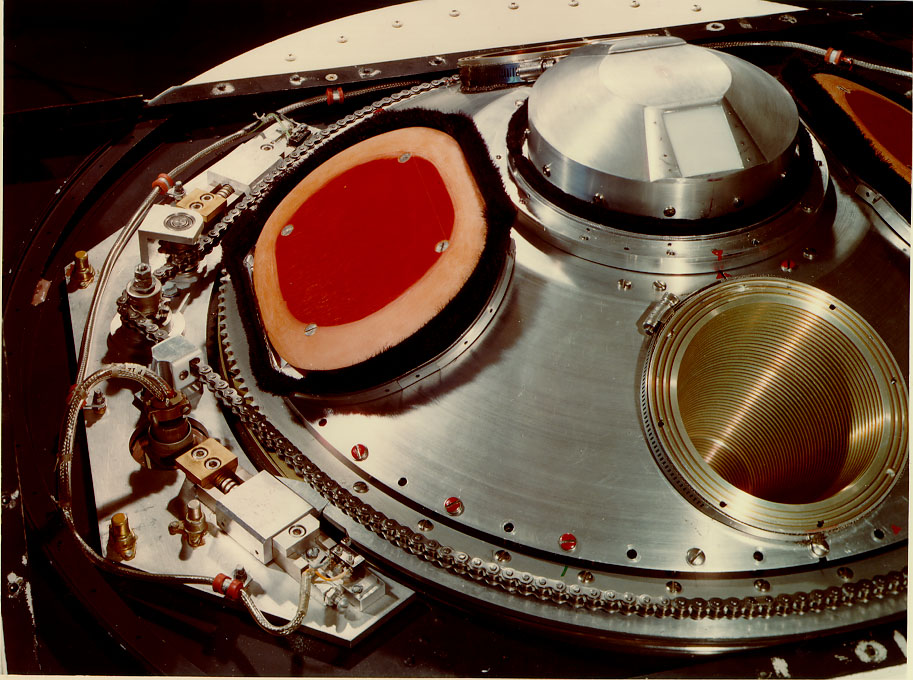 experiment in observing position with the upper hatch cover off.
Better view of the chain drive and associated features of the rotation
system.
experiment in observing position with the upper hatch cover off.
Better view of the chain drive and associated features of the rotation
system.  DMR in the U2 with the hatch cover and protective metal fairing
removed. The metal fairing was a mechanical and electrical protection
for the equipment. One can see the two radiometers and
other associated electronics. This was very much a prototype
of two of the COBE DMR radiometers. The two radiometers worked
at 33 and 54 GHz while the COBE radiometers worked at 31.5 and 53 GHz.
The 90 GHz concept was tested in the laboratory and by balloon-borne
experiments.
(see balloon-borne CMB anisotropy.)
DMR in the U2 with the hatch cover and protective metal fairing
removed. The metal fairing was a mechanical and electrical protection
for the equipment. One can see the two radiometers and
other associated electronics. This was very much a prototype
of two of the COBE DMR radiometers. The two radiometers worked
at 33 and 54 GHz while the COBE radiometers worked at 31.5 and 53 GHz.
The 90 GHz concept was tested in the laboratory and by balloon-borne
experiments.
(see balloon-borne CMB anisotropy.) 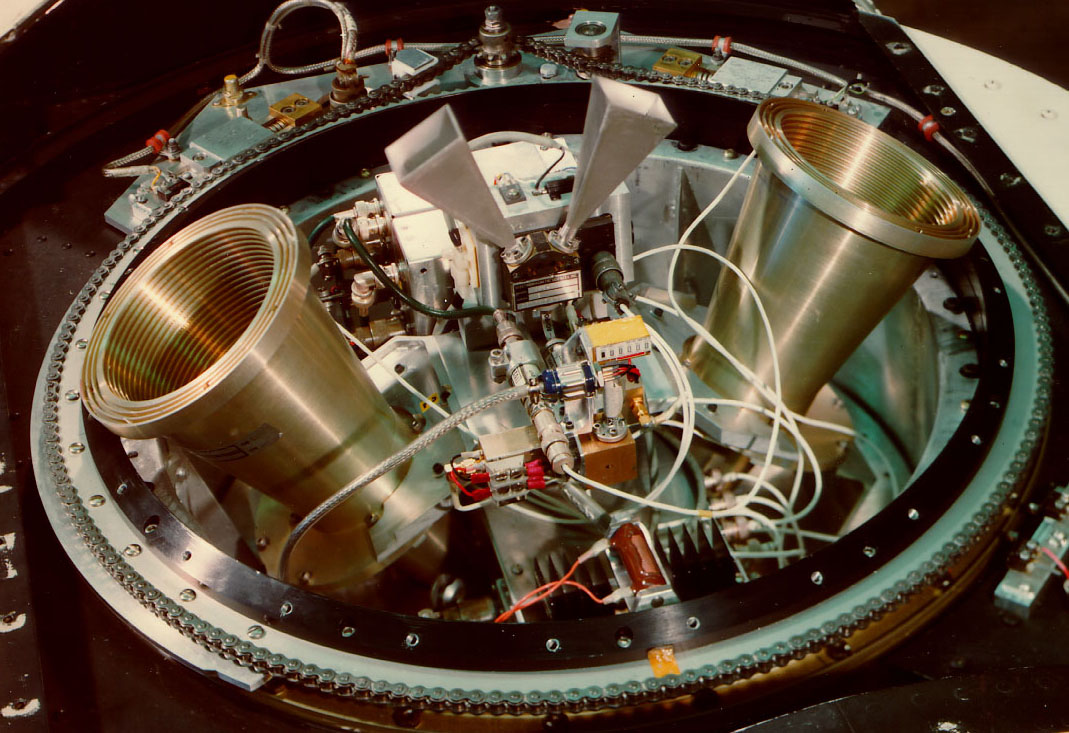 DMR in the U2
close-up with the hatch cover and protective metal fairing removed.
DMR in the U2
close-up with the hatch cover and protective metal fairing removed.