The images below were created from the COBE DMR data products. Each image has been histogram equalized, giving a non-linear relation between color value and temperature. Use the Project Data Sets or the Analyzed Science Data Sets for quantitative analysis.
Maps Based on Two Years of DMR Observation
Cosmic microwave background temperature data were extracted from the released FITS files and then combined into two linear combinations. The first is a weighted sum of the 53 and 90 GHz channels which gives the highest signal-to-noise ratio for cosmic temperature variations but includes the Milky Way Galaxy as well. In the second linear combination, a multiple of the 31 GHz map is subtracted from a weighted sum of the 53 plus 90 GHz channels to give a "reduced map" that gives zero response to the observed Galaxy, zero response to free-free emission, but full response to variations in the cosmic temperature.
These maps have been smoothed with a 7-degree beam, giving an effective angular resolution of 10 degrees. An all-sky image in Galactic coordinates is plotted using the equal-area Mollweide projection. The plane of the Milky Way Galaxy is horizontal across the middle of each picture. Sagittarius is in the center of the map, Orion is to the right, and Cygnus is to the left.
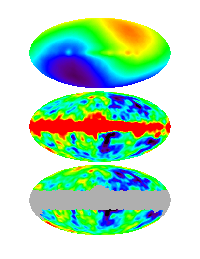
The following image is similar to the June 1992 Physics Today cover picture, with the map including the dipole and Galaxy on the top, the dipole removed map in the middle, and the reduced map on the bottom. The dipole, a smooth variation between relatively hot and relatively cold areas from the upper right to the lower left, is due to the motion of the solar system relative to distant matter in the universe. The signals attributed to this variation are very small, only one thousandth the brightness of the sky.
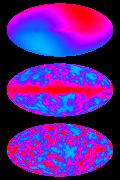
Click on the image to view the original
The following image just shows the reduced map (i.e., both the dipole and Galactic emission subtracted). The cosmic microwave background fluctuations are extremely faint, only one part in 100,000 compared to the 2.73 degree Kelvin average temperature of the radiation field. The cosmic microwave background radiation is a remnant of the Big Bang and the fluctuations are the imprint of density contrast in the early universe. The density ripples are believed to have given rise to the structures that populate the universe today: clusters of galaxies and vast regions devoid of galaxies.
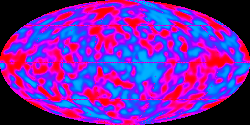
Click on the image to view the original
Maps Based on Observations Made Over the Entire 4-year Mission
Some of the features seen in the four-year maps below (i.e., dipole, Milky Way Galaxy) were described above. Like the two-year maps, the four-year maps have been smoothed to an effective angular resolution of 10-degrees. At this angular scale, the signal-to-noise ratio is sufficient (~2 per 10-degree patch) to portray for the first time an accurate visual impression of the cosmic microwave background (CMB)anisotropy.
The following image represents DMR data from the 53 GHz band (top) on a scale from 0 - 4 K, showing the near-uniformity of the CMB brightness, (middle) on a scale intended to enhance the contrast due to the dipole described above, and (bottom) following subtraction of the dipole component.
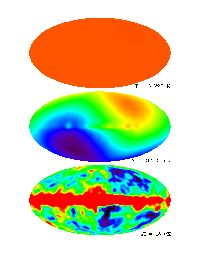
Click on the image to view the original
The next image shows data obtained at each of the three DMR frequencies - 31.5, 53, and 90 GHz - following dipole subtraction.
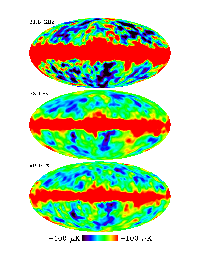
Click on the image to view the original
The following image shows the 53 GHz map (top) prior to dipole subtraction, (middle) after dipole subtraction, and (bottom) after subtraction of a model of the Galactic emission. The Galactic emission model is based on COBE/DIRBE far-infrared and Haslam et al. (1982) 408 MHz radio continuum observations. For analysis of the CMB anisotropy the area around the Galactic plane is excluded (bottom panel). The excluded pixels are listed in two files that can be retrieved by anonymous ftp from the cobe/asds/dmr/dat directory on nssdca.gsfc.nasa.gov.
Click on the image to view the original
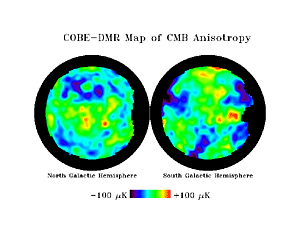
Finally, here is the COBE-DMR "Map of the Early Universe." This false-color image shows tiny variations in the intensity of the cosmic microwave background measured in four years of observations by the Differential Microwave Radiometers on NASA's Cosmic Background Explorer (COBE). The cosmic microwave background is widely believed to be a remnant of the Big Bang; the blue and red spots correspond to regions of greater or lesser density in the early Universe. These "fossilized" relics record the distribution of matter and energy in the early Universe before the matter became organized into stars and galaxies. While the initial discovery of variations in the intensity of the CMB (made by COBE in 1992) was based on a mathematical examination of the data, the new picture of the sky from the full four-year mission gives an accurate visual impression of the data. The features traced in this map stretch across the visible Universe: the largest features seen by optical telescopes, such as the "Great Wall" of galaxies, would fit neatly within the smallest feature in this map.
Click on the image to view the original
Back to top
|